Pages

Wednesday, June 29, 2011

RadNet Data Censorship Saint Louis, Mo 3/30/11 - 6/29/11

Updated 7/1/11: A detailed video analysis of the text and chart below may be found at the embedded link


Click on the Chart to see a higher resolution image.


Four specific types of censoring were found in the EPA data:

(1) Censored Data (deletions): Specifically Gross Beta, and Gama Energy Ranges 2 through 5, and 7.

(2) Censored Data (Burn-offs): Short Half life radiation was allow to burn-off from the sample by performing the sampling in time frames longer than the standard 1 hour sample collection time.

(3) Censored Data (short sampled): Sampling periods were cut short of their standard 1 hour sample gathering time; the result is a radiation count that is proportionally lower.

(4) Censored Data (early filter removal): Filters build up radioactive contamination. By installing a new air filter before the previous filter's useful life span has been reached, the subsequently recorded radioactivity will appear lower.

Based on my understanding of the RadNet's operational guidelines:
Samples are automatically captured every hour and sent up to the EPA to "review" the data before it is posted online. The air sampling cartridges are to be removed every 12,000 cubic meters and sent to the EPA for further analysis; this time may be cut short if unusual radiation detections are found.

As I searched through the EPA RadNet data for Saint Louis, I found two instances where a new air sampling cartridge was inserted and removed with in one or two readings and replaced with another new cartridge. The first such occurrence was on April 10th and was concurrent with all four types of observed censorship. The second occurrence was on May 25th and was concurrent with a large radiation increase.

The EPA website does state that "Electrical interference can cause spikes, shown on graphs as one point significantly higher than the rest of the data". However an examination of the data found NO such instantaneous spikes, only radiation increases predicted via previous upwards trends.

It is also interesting to note that the heaviest data censorship occurred in the early parts of the Fukushima disaster, where radiation levels would have been expected to be at their initial highest. Despite that heavy early point data censorship, the overall trending data from March through May shows a significant increase in radioactivity. I believe the increase is significant from a cancer causing perspective, but not necessarily from the perspective of inducing Radiation Sickness.

Hopefully the EPA will provide an alternate explanation of the above analysis and will support such an explanation by:

(1) Releasing all the RAW un-manipulated data
(2) Releasing all manuals and instructions covering the collection of such data.

Click HERE for the detail video analysis

Monday, June 27, 2011

[ALERT] Emergency Declared at Kansas Research Reactor- Possible Meltdown

Did anyone in Kansas know about this possible meltdown on 6/24/11? But apparently not to worry because, 
even though there was an Airborne detection of Radioactive  Iodine 131  at a concentration of 104300 becquerels per cubic meter, and "some" Cesium 137 in the air,
 
"The Reactor Manager and Radiation Safety Officer agreed that fuel damage was unlikely, but the results of testing were inconclusive". 

Reading through the report, it appears as if the Reactor Manager casually "noticed" a very high reading indicating Iodine-131; I guess they must not be funded for alarms for that sort of thing. And even though they had TWO SEPARATE very high detections, one for radioactive Iodine 131  and the other "elevated levels of activity"; (each from TWO DIFFERENT instruments) the first was "most likely mis-calibrated" and the second "probably due to the proximity of the radioactive sample handling table to the sampling location".
Anyone care to wager if the people at the handling table still have functioning thyroids?

But again, not to worry it only took these people 2 hours and 31 minutes to come up with a rationale why there was probably no nuclear meltdown in their reactor; compare that to TEPCO taking 3 MONTHS to figure out they had three complete meltdowns , and its obvious these Kansas State University people ought to be up for some kind of award.

Well hopefully the Kansas State University's K-State Alerts system sent out warning to the student body. After all  if its good enough for a possible active shooter on campus,  it ought to be good enough for a possible NUCLEAR MELTDOWN.

Update: edited for clarity, and to add a link to K-State's news release on the subject.
It is interesting to note the differences in wording from the press release and the Emergency notification to the NRC
Notice particularly how the News Release states

"The nuclear reactor used for research at Kansas State University was found to have no fuel damage after a monitoring instrument falsely reported an alarm"

compared to the NRC report statement

"..fuel damage was unlikely, but the results of testing were inconclusive..."

8:30am Thunderstorm Rainfall at 15 X Background Radiation

I took a rain sample from a piece of sheet metal in my front yard; the sample read at 15 times greater than background radiation: 0.155 mR/hr

Sunday, June 26, 2011

[BREAKING] TEPCO Document Indicates 0.6 EXA-bequerels Released on Day 2 !!!

Hat tip to EX-SKF blogsite for finding and translating this document

The TEPCO engineers believed that 0.601 EXA-bequerels of Noble gasses were released on March 12, 2011. That equates to 601,000,000,000,000,000 blasts of ionizing radiation per second. Anyone who flew in a jet into that radioactive release should keep a permanent record of your flight number, the flight path, and the flight time.

If there is a positive side to this finding it, there is now an initial starting data point which can be plugged into all those radioactive dispersal plume models; and as a result,  we may garner some idea  about the upper atmospheric concentrations of those radioactive Noble gasses which resulted from that  FIRST release.

One of the most potentially globally terrifying components of that gas release into the upper atmosphere is Xenon 133. Xe133 decays to non radioactive Cesium 133, and when the Cesium 133 in the upper atmosphere is hit by protons from a Solar Mass Ejection it will turn into a witches' brew of radioactive iodines.  The threat from that witches brew won't just  be from one point source like Fukushima; the vulnerability will potentially manifest simultaneously over the entire Northern Hemisphere. The video below explains the threat.

Saturday, June 25, 2011

8:30 pm Tornadic Storms Front Edge 7X Background Radiation

The leading edge of the 8:30pm Tornadic thunderstorms producing rain with fallout radiation at 7 times greater than background. Previous fallout measurements indicate that the trailing edge of the storms have higher radiation levels than the leading edges.

Friday, June 24, 2011

Tuesday, June 21, 2011

6/21/11 Daytime baseline Geiger Counter Reading

Outside,Geiger counter on my belt & in its case, sensor facing away from body: 83.3 minutes, 2324 counts, 0.008mR/hr. The reading is approximately 0.0003 mR/hr greater than typical. The day was mostly cloud, steady wind, 80 degF. The reading ended at 2:35pm approximately 6.5 hours after the morning storms rolled through, and roughly 1 hour before the afternoon storms started.

Children playing in a park with 60 TIMES background radiation

Children playing in a park with 60 times background radiation; a video more terrifying to a parent than any horror movie. If these children inhale, ingest, or otherwise absorb the radiation from this playground the background radiation will become internal radiation. The local is Kashiwa Japan, roughly a 3.5 hour drive away from Fukushima

Saturday, June 18, 2011

Plan for THREE M6.0 - M6.9 Fukushima Aftershocks between June 18 and July 1

The Japanese Meteorological Agency issues aftershock outlook predictions for major earthquakes. Unfortunately it does not appear that they have publicly issued such outlooks for the Tohoku Earthquake (Fukushima), and that raises the question, how does one schedule and plan rebuilding, recovery, or preparedness operations without a milestone date to meet?

Fortunately the aftershock planning question can be answered because aftershocks tend to follow a pattern that is predictable enough for the purposes for civil defense operations. The analysis below builds off of an earlier analysis and will give a good indication why it would be wise to plan for three magnitude 6 range aftershocks by July 1, 2011; and why if those aftershocks don't occur there is an expedited potential of a magnitude 7.0 aftershock.

The following chart plots the daily cumulative number of actual aftershocks minus the number of expected aftershocks. Given a long enough historical view of the data, the values would distribute around the zero line. For scheduling purposes the assumption is that any short period non-randomness is indicative of the earthquake fault line structure. From that assumption, it follows that positive numbers indicate that earthquake stresses are decreasing, and negative numbers indicate a growth in earthquake stresses. As a result, the greater the trend towards negative values the more likely the aftershock is to happen in the near future.

Examining the chart below, as of 6/17/11, there has been a deficit of almost three M6.0-M6.9 aftershocks. The history also shows no previous deficit of greater than four M6 aftershocks. Based on those boundary condition, several M6+ aftershocks would be expected before July 1, 2011. Additionally, the trending history shows that a M6 aftershock occurs whenever the downward slope (stress build up) of the M5 line crosses the M6 line. That cross over point is trending to happen on June 19, 2011.

While not predicting that a series of three M6.0-M6.9 aftershocks will happen by 7/1/11, that is the scheduling window one would follow for the purposes of recovery operations. If those M6 quakes did not occur by that time period, the schedule would have to be reassessed for an increased risk of a nearer term M7.0-M7.9 aftershock occurring before December 7, 2011.

Friday, June 17, 2011

12X Background Radiation From Trailing Edge of 12:30 pm Storm

6/17/11:  A very heavy frog strangling thunderstorm down pour hit the area around 11:30am; after approximately 1 hour of heavy rain,the down pour changed over to a light rain. The sample was taken from a paper towel swipe of the trailing edge rain, long after any naturally occurring radioactivity would have been expected to been washed out. The sample returned a reading of 12 times greater than background, 0.12 mR/hr.
Stay Out of The Rain!

Thursday, June 16, 2011

UC Berkeley Nuclear Engineer Department MELTSDOWN to ZERO after Meltdown


If there is one thing clear from the chart above it is that the University of California Berkeley Nuclear Engineering Program's future hangs in balance depending on the public's perception of and reaction to the Fukushima Nuclear disaster. It is a position they know well; after Three Mile Island, their undergraduate enrollment went to ZERO students. After the Chernobly nuclear incident, UCB's Nuke department's enrollment dropped by approximately 67%. More over it is not just the UCB that is at risk, but the entire industry. Emeritus Professor T.H. Pigford (founding chair of UC Berkeley Nuke Engineering) when asked what Three Mile island meant for the industry stated on page 149 of his PDF oral history-

"A more powerful reaction in industry was the demonstration
that the industry might not be able to survive another accident.
And they don't mean just the industry that owns the reactor, but
the whole industry
, because the whole industry is deeply affected
by poor performance in any one of the plants."


It is abundantly clear that nothing less than the ENTIRE FUTURE OF THE NUCLEAR industry hangs in balance on the management of the public's perception of the Fukushima disaster.

The enrollment data from the chart above was derived from the following PDF presentation:

The Future of Nuclear Energy: A California Perspective

Per F. Peterson
Professor
Department of Nuclear Engineering
University of California, Berkeley
California Energy Commission
2005 Integrated Energy Policy Workshop
August 15-16, 2005


The original chart is displayed below.

Tuesday, June 14, 2011

6/14/11 Post Thunderstorm Shower with Radiation 6 Times Greater Than Background

Thunderstorms rolled through Saint Louis this early this morning followed by light rain at 9:30am. The post thunderstorm rain sampled at 6 times greater than background radiation.

Monday, June 13, 2011

13 X Background Radiation, Saint Louis MO 6/13/11 9:30am

The thunderstorm passing through Saint Louis this morning at 9:30am produced a radioactive fallout reading of thirteen times greater than background radiation. Unfortunately these high fallout readings have become so ubiquitous that it hardly seems worthy of the bandwidth to post a video of the test and result; but that is how life is post-Fukushima.

Sunday, June 12, 2011

HOT PARTICLES in California, No it is NOT like Flying on a Plane

Ever since Arnie Gundersen brought up the detections of  "Hot Particles" in Seattle's atmosphere, the general public has started to realize that there is something not right about comparing the risks of Fukushima radioactive fallout to those of a pre-Fukushima flight on an airplane and the resultant exposure to cosmic rays. It is the difference between inhaling an X-ray machine vs getting an X-ray.

The danger from Fukushima is that a person will inhale and ingest radioactive fallout that will  be irradiating them  from the inside of their body for potentially their entire lifespan. Unfortunately, most scientists don't report the threat in a manner that allows a member of the general public to actually comprehend the risk in terms that they will understand.


The POTRBLOG site addressed the issue  back in April by converting the EPA's detection of Plutonium in California from units of pico-Curies per cubic meter of air into the number of Plutonium atoms the residents of California inhaled that day. The risk was further converted into how many of those Plutonium atoms would actually release an alpha particle into a person's lung, and a calculation was performed relating those hot particles inhalations to how many lung cancers might result. To make these calculations easy to find, I have created a "hot particle" tag on those posts. To read the articles follow this link.

For information regarding the nature of the EPA's  Plutonium detections in California, please follow this link


6/12/11 Minor Passing Drizzle at SIX Times Background Radiation

6 times background radiation from a few small drops of passing drizzle in Saint Louis Missouri

Saturday, June 11, 2011

6/11/11 2pm Rain & Drizzle @ 50X Background Radiation in Saint Louis Mo


Sample taken from my truck of light drizzle. The combined samples read at 50 times normal background radiation.

A sample was filtered for Alpha, Beta, and Gamma Radiation.
Unfiltered: 0.44 mR/hr (Alpha+Beta+Gamma)
Filtered with plastic: 0.05 mR/hr (Gamma + strong Beta)
Filtered with paper: 0.265 mR/hr (Beta+Gamma)
Estimated Alpha: 0.166 mR/hr (Alpha)

6/10/11 Evening Storm @ 14X Background Radiation in Saint Louis Mo


This rain sample from the 10:30 pm storms came from a piece of sheet metal in my front yard. The reading maxed out at 0.141 mR/hr, approximately 14 times background levels

Wednesday, June 8, 2011

The Aurora Borealis' New Nuclear Sheen


Read the details here


[Threat Alert] Solar Proton Bombardment of High Atomic Weight Fallout

[Threat Alert] Solar Proton Bombardment of High Atomic Weight Fallout

A Solar Coronal Mass Ejection with Proton energies of greater than 100 MeV is set to make a "glancing" blow on the Earth 6/8/11 and for a few days following. The Solar storm will be the strongest since 2006 and will result in the visibility of the Northern Lights in Latitudes north of 38 degrees; the light show has the potential to be more unusual than normal because the upper atmosphere is filled with high atomic weight fallout from Fukushima.

The Fukushima fallout, both the radioactive stuff and the stuff that has decayed to be non radioactive, will be slammed with high energetic particles from the Solar Coronal Mass Ejection. Those particles include electrons, alpha particles, and protons, all of which may have energies broaching 1000 MeV. The result of those solar particles slamming into the radioactive and non-radioactive high atomic weight Fukushima fallout is a veritable witches brew of nuclear spallation, photofission, and et al generated deadly radioactive elements.

What makes this witches' brew of interactions potentially catastrophic is that unlike Fukushima where the radiation is coming from one single point on the planet in a continuous pump like fashion; these Solar particle nuclear spallations can create new dangerous radioactive particles near simultaneously over the entirety of the Northern Hemisphere. Unfortunately, this is almost all uncharted territory.

There is no readily available Arnie Gundersen equivalent who can give us a seat of the pants estimate of the likely damage from these interactions. Without the proper tools to model these interactions and quantify the risk, and absent anyone with requisite tools publicly stepping forward, the best I can offer is a readily verifiable description of ONE of MANY such Solar/Atmospheric nuclear spallation interactions and the worst case consequence. Hopefully as a result, someone with the right tools will step forward and provide a risk matrix with the associated likelihoods and impacts of these events.

Probably the easiest threat for the public to verify from the nuclear spallation of Fukushima fallout via Solar Coronal Mass Ejection is the production of radioactive iodine from the high energy spallation of Cesium 133 from solar produced protons. Fukushima has pumped the upper atmosphere full of radioactive Xenon 133. There are plenty of plume models that show the contamination, here is an example of one.


The radioactive Xenon 133 shown in the above chart has a half life of 5 days, after which half of it turns into non-radioactive Cesium 133. That non-radioactive Cesium 133 continues to float around in the upper atmosphere until it gets hit by a high energy proton ejected from a Solar Storm. Well it just so happens, that bombarding Cesium 133 with high energy protons is a method described in a US Patent to manufacture radioactive Iodine.


In short, the proton slams into the Cesium 133 like a cue ball into a rack of billiard balls. The result is the production other sub-atomic particles that shoot off looking to slam into something else, and a plethora of radioactive high atomic weight elements like 123Xe, 125Xe, 123I, 124I, 125I, 126I, and 129I. These radioactive Iodine and Xenon particles have half lives that range from hours to thousands of years. The radioactive particles which don't end up raining down into our thyroids are free to float around in the upper atmosphere for the next spallation (or other) reaction.

It is a scenario which sounds like a Bond villain's attempt to destroy the thyroid of every living mammal in the Northern Hemisphere. Unfortunately the long term high atomic weight atmospheric pump coming out of Fukushima combined with the upcoming Solar Maximum events over the next several years, moves the event from the realm of science fiction into the realm of the not impossible. Moreover this is only ONE of MANY such possible interactions.

Even though these spallation interactions will occur, I don't have access to the tools to readily calculate the distribution likelihood and impacts of these events. But, I can provide at least one rough guideline that people can use to judge some aspects of the threat. The size of the threat is proportional to visibility of the Northern Lights from lower latitudes. Charged particles from the sun flow towards the poles; solar storms cause geomagnetic affects that allow those particles to impact further away from the poles. The danger coincides and increases with the Northern Lights stretching further south. Hence, the greater the potential visibility of the the Northern Lights, the greater the risk of Solar induced nuclear spallation reactions.

In the current 6/8/11 Solar storm, the impact zone is as far south as Latitude 38 degrees North (roughly Saint Louis). That risk zone applies for the entire Northern Hemisphere from Scandinavia, Greenland, Russia, Canada, and the USA. The affect should be strongest on the the Sun lit side of the planet. Stay Out Of The Rain, don't fly through fallout, and say your prayers.

Monday, June 6, 2011

325,000 Radioactive Fallout Baby Teeth in Saint Louis = Increase in Cancer Deaths

Washington University Scientists in Saint Louis Missouri collected over 325,000 baby teeth during the 1950's and 1960's. The baby teeth were used to track the environmental uptake of radioactive fallout in children. A significant amount of detail was recorded about each and every tooth.

Forty years later; 85,000 thousand of the unused teeth were found in storage. The data from those teeth allowed researchers to track down people who had died of cancer by their late 40's. The key results from that study showed that "the average Sr-90 concentration in teeth of persons who died of cancer was 122% greater, or more than twice the level for healthy persons the same age. The 122% excess was statistically significant at p<.04."

The connotations of the effects of the Fukushima Fallout on our children are obvious. My own Geiger counter tests have shown that the radiation in our rainfall has been up to 60 times greater than would be expected from naturally occurring phenomena. It is unclear if the Fukushima fallout is hitting Saint Louis harder than anywhere else. But, if there were one location in the North America where the local weather conditions would have the strongest capability of pulling radioactive material out of the upper atmosphere, it would here in Saint Louis where the Jet Stream and Tornado alley meet the humid confluence of the Missouri, Illinois, and Mississippi rivers. It has also been pointed out to me that Saint Louis and Fukushima practically lay on the same Latitude, meaning that Fukushima is directly due west of Saint Louis.

We may not see, hear, smell, or taste the evil that is washing down up on us; but we still can mitigate the risk. Stay out of the rain; avoid dairy products; avoid fruits and vegetables grown north of the Equator; use a WP4-V water filter in your home; drink filtered bottled water when away from home, or use a refillable filtering water bottle like the Sport Berkey Portable Water Purifier;  if you have to fly consider wearing a a filter mask ; if you have to drive in the rain, consider turning on the air conditioner and setting the vehicle's environmental controls to recirculate.  Finally as the study above has shown us, the tooth fairy might want to keep her finds (and associated data) for future testing.


You can find a summary of the Saint Louis radioactive fallout tooth and cancer study at this link; there are also roughly 17 copies of the book available on Amazon.

Two Hundred and Thirty Nine Aftershocks Facing Fukushima by Sept. 9th, 2015


The following "quick answer" analysis won't show you how to predict aftershocks, but it is an example of how to use limited earthquake aftershock data to make complex decisions involving allocating resources, developing repair priorities, and creating construction schedules to maximize the chance of recovery at Fukushima Daiichi. Those of us here in the USA might best use this information to make our own preparedness decisions based on how well TEPCO's work is coming along in reference to the projected earthquake aftershock data presented below.

It may just be coincidence, but I would prefer to believe some unknown and unsung hero in Japan has already used this type of technique to schedule the building of the new protective sea wall around Fukushima Daiichi. Plotting and trending the aftershock data would have shown that it would be very risky to start work on a new seawall before 60 days had past; those resources and manpower would be better used and redirected towards controlling the nuclear aspects of the crisis. The data also indicates that the sea wall work should have a completion milestone set within 300 days of the start of the crisis. Hopefully, TEPCO is using the this technique to make risk management and resource allocation decisions on implementing repairs to the reactors and reactor buildings.

The charts below show the total number of aftershocks that have all ready occurred (in blue), and they use that data to project how the coming aftershocks will distribute out over the next 4 and 1/2 years (in red). The analysis was run out to 1644 days (4.5 years) because the historical data from Japan indicates that the largest aftershock will occur within 4.5 years; that aftershock would be expected to be in the 8.0 magnitude range. Obviously the fewer the number of actual aftershocks that have occurred for each Magnitude listed, the more tenuous the projection.


Saturday, June 4, 2011

Radioactive Tap Water Risk Mitigation for the Office and Outdoors

The best risk mitigation solution for removing radioactive contamination from drinking water is to use the Watts Premier WP4-V reverse osmosis (RO) water filter system (shown on the Amazon Risk Mitgation widget on the left side of the web page). It is the ONLY readily available cost effective RO filter that meets ANSI / NSF standards 53 and 58. This what we have installed and use in our home, so far we are quite pleased with the WP4-V.


But what do you do when at the Office or when you are out and about? 
The best solution I have found is the Sport Berkey Portable Water Purifier. They are NOT certified by the NSF for standards 53 & 58; and the company seems to rely more on its own hype combined with some independent testing. However, The filter's construction should remove dissolved radioactive gasses and they do seem to be a much better solution than other portable bottle or pitcher water filters. My family has been using one for over a month and we are quite satisfied with its use and convenience. By no means is it a perfect solution, but it is a cost effective risk mitigation strategy. And for any one who has ever tried to drink the tap water in Disney World, the bottle could readily pay for itself in one day at the park.

Here is the Amazon link for the Sport Berkey Water Purifier

Good Gosh Golly Gundersen Gives Great Guidance

Arnie Gundersen gives some overall good insight and guidance in this Pod cast.

Listen to Part 2 first for the guidance

http://www.chrismartenson.com/martensonreport/part-2-arnie-gundersen-interview-protecting-yourself-if-situation-worsens

 The disposable masks listed on the left side of the blog page are a good example of what to look for in overall cost efficient protection (especially if you have to fly)

These are the specific masks I have purchased.

UPDATE 6/6/11  I don't wear these masks in the rain or wet, because wet activated carbon is known to absorb oxygen.


Listen to Part 1 for the Fukushima Analysis

http://www.chrismartenson.com/blog/exclusive-arnie-gundersen-interview-dangers-fukushima-are-worse-and-longer-lived-we-think/58689

Thursday, June 2, 2011

Is Your Lawn Radioactive Too? N95 Dust Mask Test


I mowed the lawn on Labor Memorial Day, and wore the N95 dust mask shown in the video. After roughly 2 hours in the backyard mowing, the Geiger counter readings of the mask showed radioactive contamination as high as 0.03 mR/hr. Normally I would call that 3X background, but background levels were a little more variable the day of the test making the reading less precise. To be conservative, the contamination readings from the mask varied from 1x to 2x background radiation. The grass was dry to the touch in the yard, but slightly damp in the bag. No visible dirt or dust was kicked up from the mowing. I have performed the same test a few times over the last several weeks, and there has been indications of radioactive contamination every time.

EPA data says 67% Chance of Plutonium in Riverside California; Review says 98%+


THE ABOVE CHART IS THE MATHEMATICAL FACT OF THE EPA's DATA. One has to wonder why months after the detection no one else in authority or expertise has so clearly and unequivocally stated what the mathematics of the EPA's data actually state? On the contrary, the EPA has it listed as a non-detect; the BRAWN team from the University of California Berkeley Unclear Engineering Department has interpreted the data to mean, "In statistical terms, this is "consistent with zero," i.e., a non-detection"

The facts of the mathematics belie the BRAWN team's "interpretation". I have postulated in the past that the University of California Berkeley Unclear Engineering Department's BRAWM team is all BRAWM and NO BRAINS; the following analysis hopefully will provide the BRAWN team with some insight and allow them to publicly correct their "interpretation" with the actual facts above.

The EPA data lists a detection of 0.0000013 pico Curies per cubic meter (pCi/M3) of Plutonium 238. They also identify a "Combined Standard Uncertainty" (CSU) of 0.000003 pCi/M3. The CSU is just a fancy way of saying that the EPA is guessing at how uncertain they are of their result. Even though it is just a guess, it is treated as if it were a mathematically calculated Standard Deviation (Sigma). The range of possible results given the EPA's number is represented by the blue bell curve shaped line in the chart above. The most likely answer is found under the highest peak of that blue bell curve. The extreme ends of the curve are that answer + and - three times the CSU (guessed Sigma). The less space there is under the curve, the less likely that particular answer is to be the correct one.

Looking at the Chart above, it is clear to see that 67% of the probable answers are to the right of the zero value, and 33% of the probable answers are to the left of the zero value. It is those values that are the actual probability of Plutonium detection. Of course one has to ask why does the EPA even lists detections with negative values, how is that possible? A negative value is only possible because the EPA massages the numbers before they release them; They subtract off a value which represents how wrong they guess their instruments are in terms of the actual detection quantity.

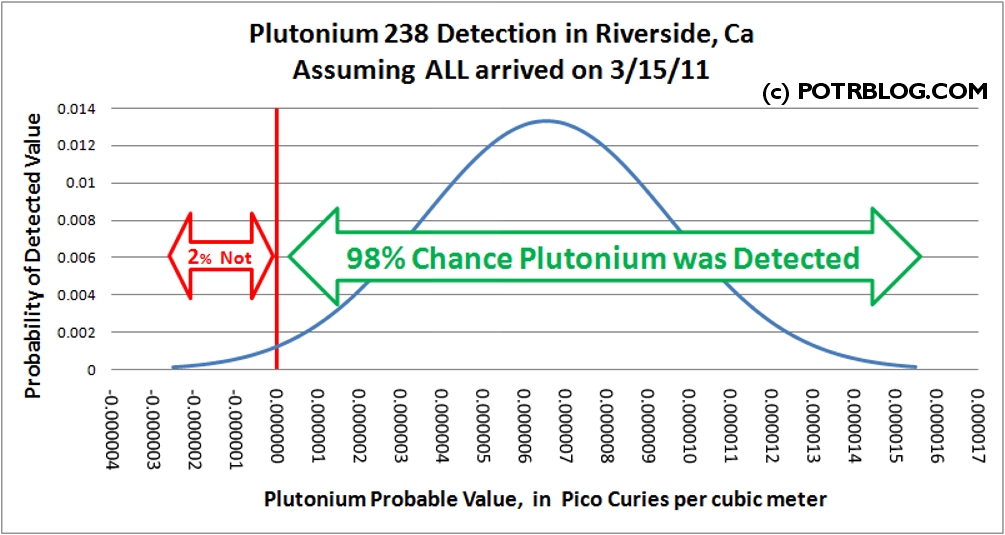
Moreover, notice that the EPA took the sample over 5 days, March 11-15. A more competent interpretation of the data provided by the EPA would increase the strength of the detection to 0.0000065 pCi/M3, and raise the detection level confidence to 98%. The significance of the measurement time frame is that Fukushima melted down on March 11; the travel time to Riverside would indicate that all of the detected Plutonium 238 would have been captured by the air filter no earlier than March 15. In short, that means the detection should not have been averaged over 5 days, but rather 1 day; hence, the detection is actually 5 times greater than the EPA indicated. A quick analysis of other CSU guesses from other detections shows they do not fluctuate much with the air sample size or number of days measured; hence, no change in the CSU.

The result is shown in the next chart, a 98% certainty of Plutonium 238 detection. All the exact same information holds true for the EPA's additional detection of Plutonium 239 during the same time period.


However, the analysis does not stop there. For the exact same March 11-15 time period, the EPA also has detections for Uranium-234, Lead-212, and Uranium-238; all of which are part of the nuclear chain for Plutonium 238. The fact they were all detected together makes them a veritable fingerprint identification of Plutonium 238 coming from a fuel rod. The detection of Plutonium 239 was also found with a similar fingerprint of Uranium 235. By March 15, there would be no more publicly listed Plutonium or Uranium testing from the EPA, but they continued Gamma Spectrometry until March 18. Those results indicated a finding of Thallium-208, Bismuth-212, Lead-212; once again, further confirming the fingerprint of Plutonium 238 from a fuel rod.

But that is not the last nail in the coffin; the ratio of detected Plutonium 238 to detected Plutonium 239 was one to one. Pu 238 has a much shorter half life than Pu 239. The Pu 238/ Pu 239 ratio one would expect to find, if this detection were from old above ground nuclear weapons testing, is 0.026. The fact that the ratio is much greater is a direct indication that the Pu 238 was a result of Fukushima. (even TEPCO admits this for Japan's fallout).


The question still remains, what is the health effect for the people in Riverside, California? I can't answer that directly. But, I did do my own risk assessment assuming I lived in Riverside, and assuming that one Plutonium atom decaying in my lungs would lead to lung cancer (an assumption of unknown risk). It is important that the resultant calculation be understood within the context of its assumptions and ground-rules, follow the link if you want to see the results; then ask why its up to one downwind website in Missouri to provide you with information that should be locally forth coming as a result of your own State and Federal tax dollars.

UPDATE 6/3/11

I have added a link to the National Institute of Standards and Technology that gives some good insight into the math and proper application of Combined Standard Uncertainty.

http://physics.nist.gov/Pubs/guidelines/sec5.html